![]()
Sales and Market Share Graphing Module
The SAS sales and market share graphing module utilizes syndicated product and locally collected voice share data for Company and top competitive companies. Here are two examples of Graphs outputed using the SAS Graphing Module.
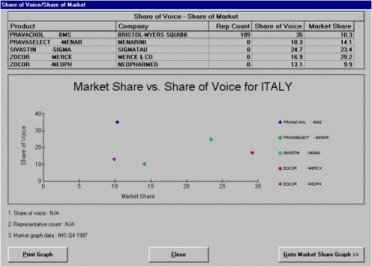
The Rep Count, Share of Voice and Market Share data and footnote comments utilized in the above graph reflect data in the Product Information screen. The graph will begin plotting with the first non-zero sales and market share period (Pn).
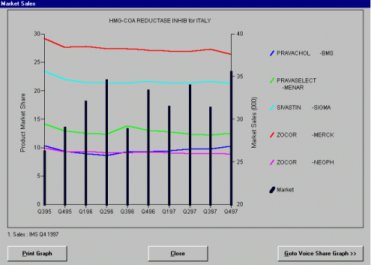
The Market Share and Product Sales data and footnote comment utilized in the above graph reflect data in the Product Information screen. The graph will begin plotting with the first non-zero sales and market share period (Pn).
